Skip to content
Link copied to clipboard

For the Flyers, getting the game’s first goal is critical | Inside the numbers

Nobody was worse in the first period than the orange and black last season. Getting that turned around will be a big step in getting back to the postseason.
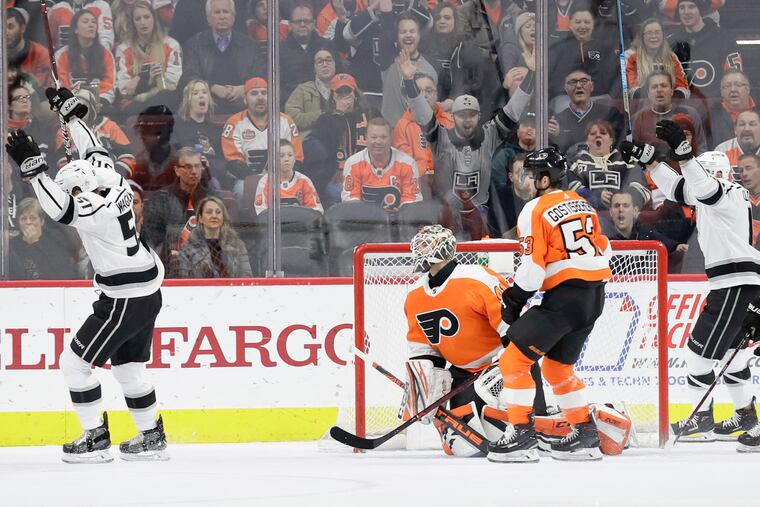
Kings left wing Austin Wagner (left) celebrates a first-period goal against the Flyers last season. The Orange & Black was 7-16-2 at home last year when they gave up the first goal, including this game which they lost in a shootout. They were 12-2-2 when they scored first at the Wells Fargo Center.
Kings left wing Austin Wagner (left) celebrates a first-period goal against the Flyers last season. The Orange & Black was 7-16-2 at home last year when they gave up the first goal, including this game which they lost in a shootout. They were 12-2-2 when they scored first at the Wells Fargo Center.Read moreYONG KIM / Staff Photographer

There’s such a fine line in the NHL between getting to the playoffs or ending up in the draft lottery. It can be even as simple as scoring the game’s first goal.

Of the 16 teams to make the postseason last year, 13 of those teams scored the first goal in more than half of their games. Being up one versus being down one is significant. The Flyers? They were among the worst.

“It’s tough to play that way, and part of it comes down to depth and the overall talent level of your team,” Flyers general manager Chuck Fletcher said. “For me, training camp is extremely important any year, but in particular this season. We have to change, and AV is going to come in and set a high standard in camp for our team, and he’s going to hold our players accountable.”

‘Structure and habits’

The Flyers last season jumped out to a 1-0 lead just 32 times in 82 games. In other words, they found themselves chasing the game more than 60 percent of the time. They won 21 of the 32 games they scored first, and lost in regulation 31 of the 50 games they trailed 0-1.

Inquirer beat writer Sam Carchidi even tracked the 32 games the Flyers faced an 0-2 deficit. They came back to win just four.

“Generally speaking,” Fletcher told Carchidi, "if you work at doing things the right way day after day, then you develop those good habits that allow you to have success when the game starts. It all comes down to structure and habits and details and just playing the right way. If we do, not only will we be better defensively, but we’ll have the puck more often and we’ll be able to dictate the play instead of chasing games and reacting to what the other team is doing all the time.”

Scoring first in 2018-19

Most often
St. Louis
Games
48 of 82 (59 percent)
W-L up 1-0
36-8-4
W-L down 0-1
9-20-5
Most often
Pittsburgh
Games
47 of 82 (57 percent)
W-L up 1-0
28-11-8
W-L down 0-1
16-15-4
Most often
Arizona
Games
47 of 82 (57 percent)
W-L up 1-0
29-14-4
W-L down 0-1
10-21-4
Most often
Boston
Games
46 of 82 (56 percent)
W-L up 1-0
34-7-5
W-L down 0-1
15-17-4
Most often
New Jersey
Games
46 of 82 (56 percent)
W-L up 1-0
25-15-6
W-L down 0-1
6-26-4
Most often
Tampa Bay
Games
46 of 82 (56 percent)
W-L up 1-0
39-4-3
W-L down 0-1
23-12-1
Most often
Also
Games
W-L up 1-0
W-L down 0-1
Most often
Flyers
Games
32 of 82 (39 percent)
W-L up 1-0
21-6-5
W-L down 0-1
16-31-3

Notable: St. Louis won the Stanley Cup, going 13-3 in playoff games they scored first, 3-6 when they did not. Boston, the Cup runner-up, was 13-3/2-6 in the postseason ... Arizona and New Jersey did not make the playoffs last season. They were among the worst teams in hockey when they did not score the first goal. Arizona (10-21-4 when down 0-1) finished four points out of the final playoff spot in the West. New Jersey was 6-26-4 when allowing the first goal.

Trailing 0-1 in 2018-19

Most often
Minnesota
Games
53 of 82 (65 percent)
W-L up 1-0
20-6-3
W-L down 0-1
17-30-6
Most often
Los Angeles
Games
52 of 82 (63 percent)
W-L up 1-0
21-6-3
W-L down 0-1
10-36-6
Most often
Flyers
Games
50 of 82 (61 percent)
W-L up 1-0
21-6-5
W-L down 0-1
16-31-3
Most often
Vancouver
Games
49 of 82 (60 percent)
W-L up 1-0
24-6-3
W-L down 0-1
11-30-8

Notable: All four teams missed the playoffs by more than 10 points.

Difference between 1-0 and 0-1 for Flyers

Flyers’ last 5 seasons
2018-19 - Scored first (32 games)
Overall
21-6-5
Record at home
12-2-2
Record on road
9-4-3
Flyers’ last 5 seasons
2018-19 - Trailed 0-1 (50 games)
Overall
16-31-3
Record at home
7-16-2
Record on road
9-15-1
Flyers’ last 5 seasons
Season: Missed playoffs by 16 points
Overall
Record at home
Record on road
Flyers’ last 5 seasons
Overall
Record at home
Record on road
Flyers’ last 5 seasons
2017-18 Scored first (36 games)
Overall
24-6-6
Record at home
15-3-2
Record on road
9-3-4
Flyers’ last 5 seasons
2017-18 Trailed 0-1 (46 games)
Overall
18-20-8
Record at home
7-10-4
Record on road
11-10-4
Flyers’ last 5 seasons
Season: Lost in first round
Overall
Record at home
Record on road
Flyers’ last 5 seasons
Overall
Record at home
Record on road
Flyers’ last 5 seasons
2016-17 Scored first (34 games)
Overall
20-10-4
Record at home
10-2-3
Record on road
10-8-1
Flyers’ last 5 seasons
2016-17 Trailed 0-1 (48 games)
Overall
19-23-6
Record at home
15-9-2
Record on road
4-14-4
Flyers’ last 5 seasons
Season: Missed playoffs by 8 points
Overall
Record at home
Record on road
Flyers’ last 5 seasons
Overall
Record at home
Record on road
Flyers’ last 5 seasons
2015-16 Scored first (38 games)
Overall
25-9-4
Record at home
16-4-3
Record on road
9-5-1
Flyers’ last 5 seasons
2015-16 Trailed 0-1 (44 games)
Overall
16-18-10
Record at home
7-6-5
Record on road
9-12-5
Flyers’ last 5 seasons
Season: Lost in first round
Overall
Record at home
Record on road
Flyers’ last 5 seasons
Overall
Record at home
Record on road
Flyers’ last 5 seasons
2014-15 Scored first (32 games)
Overall
22-4-6
Record at home
17-2-2
Record on road
5-2-4
Flyers’ last 5 seasons
2014-15 Trailed 0-1 (50 games)
Overall
11-27-12
Record at home
6-9-5
Record on road
5-18-7
Flyers’ last 5 seasons
Season: Missed playoffs by 14 points
Overall
Record at home
Record on road

Flyers in first period /Last 5 years

The Flyers haven’t lost a home game in regulation when they’ve led after the first period in five years. Problem has been they haven’t had the lead very often after the opening 20 minutes.

At home
2018-19
Lead after first
8-0-1
Trail after first
5-11-2
At home
2017-18
Lead after first
7-0-2
Trail after first
3-8-4
At home
2016-17
Lead after first
8-0-2
Trail after first
6-7-1
At home
2015-16
Lead after first
8-0-0
Trail after first
3-6-4
At home
2014-15
Lead after first
14-1-2
Trail after first
3-8-4
On road
2018-19
Lead after first
9-2-2
Trail after first
3-13-2
On road
2017-18
Lead after first
5-1-3
Trail after first
4-7-2
On road
2016-17
Lead after first
4-1-0
Trail after first
2-9-2
On road
2015-16
Lead after first
5-3-1
Trail after first
1-9-2
On road
2014-15
Lead after first
5-1-3
Trail after first
2-13-2

And finally

*The Flyers were 30th among 31 teams with 94 goals allowed in the first period last season. Only Chicago (96 goals) gave up more.

*The Rangers were +19 in first-period scoring margin during Alain Vigneault’s five seasons as coach. The numbers range from +30 in his second season (2014-15) to -18 in his final year in New York (2017-18).

*The Rangers goal margin was even in the first period in his first season with the Rangers, something the Flyers would be thrilled to accomplish this year after the way they played in the first last season.

*The Flyers first-period goal differential in 2018-19 was -31, easily the worst in the NHL. L.A. was second at -21.

*Vigneault on last year’s Flyers’ struggles: “That’s in the past. Everything is new now. Everything is a clean slate as far as I’m concerned.”