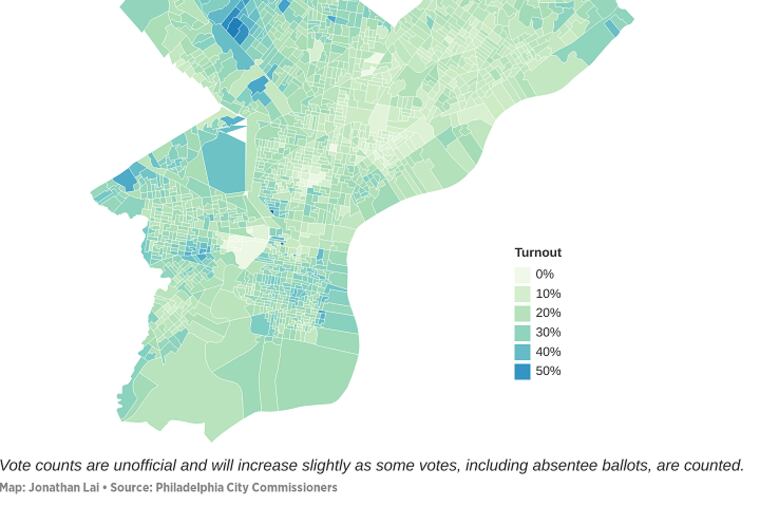
More Philadelphians voted Tuesday than in the 2017 elections or the 2018 primary
Turnout was around 23 percent in Tuesday’s election — better than some elections, worse than others.

About 240,000 Philadelphians — or less than a quarter of those registered — voted in Tuesday’s municipal primary election, but that was more than in the 2017 municipal elections or last year’s congressional and gubernatorial primary election.
Viewing this on mobile? If you don’t see the chart above, click here to switch versions.
That meant about 23 percent of the city’s 1,051,213 voters participated in the election.
NEW: Here's an early look at turnout in the 2019 Primary Election in Philadelphia. Results available at https://t.co/Ovkg8fJXf6 #PhillyVotes pic.twitter.com/L9c2wOpCn5
— Commissioner Al Schmidt (@Commish_Schmidt) May 22, 2019
Voter turnout is considered important in several ways, including as one measure of political engagement and enthusiasm. Political campaigns often target voters based in part on their voting history, and turnout patterns can help shape strategy for future campaigns.
Turnout also matters because politicians focus on voters more than on constituents writ large — officials know which demographic groups, which neighborhoods, and which communities vote, and that affects policy.
Who votes?
Older people are more likely to vote than their younger counterparts. The wealthier are more likely to vote than the poorer, and the more educated tend to show up at polls more often than the lesser educated.
That’s generally true across elections. In addition:
Primary elections draw fewer voters than general elections, in part because voters cannot simply vote based on party in a primary. Party signal is an important cue for many voters in general elections, but not in intraparty primary contests.
Municipal elections have lower turnout than presidential ones for a variety of reasons, including that some voters see presidential elections as most important and they receive the most media coverage and generate the largest amount of political advertising.
Voters tend to be most interested in elections with an open seat at the top of the ticket. When an incumbent is running for reelection, such as when Gov. Tom Wolf ran for reelection in last year’s primary election, that tends to reduce competition, advertising, and attention to the race.
Voters are particularly mobilized when they are personally contacted, such as when a campaign knocks on their door while canvassing a neighborhood. A good ground game can increase turnout.
Harder to know in the moment is how the broader political and larger context may shape turnout. For example, President Donald Trump’s election sparked high levels of activism on the left, and last year’s midterm elections in particular showed a surge in Democratic turnout. But the 2017 municipal elections saw low turnout and the 2018 primary was even lower.
How to measure turnout
Analyzing turnout is complicated.
At its simplest, turnout is just a matter of taking the number of people who voted out of the total number of registered voters, answering the question of what percentage of eligible voters actually cast ballots. But it is imperfect.
The number of registered voters is almost never a precise reflection of the actual electorate. Voters are constantly moving without changing their registrations. For example, consider college students who come to Philly, register, and then leave after graduating — they’ll still be on the voter rolls for several years after graduating, though they are no longer here to vote.
With one cleaning of the voter rolls to remove inactive voters — and others, such as those who have died — the number of registrations suddenly changes. The resulting turnout percentage would be different.
Some political scientists avoid the registration problem by measuring turnout as a percentage of people who would be eligible to vote regardless of whether they are registered.
Pennsylvania also has a “closed primary” system in which only registered Democrats and Republicans can vote only for their own parties’ candidates. Often, all voters are eligible to participate by voting on ballot questions, as was the case Tuesday, but third-party and independent voters may not be interested in voting just on those questions.
Exact turnout numbers are also not available immediately after an election. Right now, the vote count is still unofficial, with some votes, including absentee ballots, to be counted. Those will ultimately add a few thousand votes to the overall count.
Voter turnout across the city
Turnout varies a lot across the city. It was particularly low in the 7th District, where turnout is always low, and highest in the Northwest.
Even in districts with competitive council races, turnout did not appear to spike upward, compared with the rest of the city. The 7th District — with turnout of less than 15 percent — had one of the city’s most competitive races, one in which incumbent Maria Quiñones-Sánchez won reelection with a current lead of fewer than 500 votes.
In the 3d District, where longtime Councilwoman Jannie Blackwell was unseated by Jamie Gauthier, turnout was only slightly higher than the city average.
A previous version of this article gave an incorrect number of registered voters. There were 1,051,213 registered voters.