What new census data tell us about Pa.’s politics: More influence for Philly and Latinos, and a shrinking white vote
The shifts mirror national trends showing growth in denser, diverse, and generally more liberal areas while conservative rural regions shrink but retain power due to disproportionate representation.
Pennsylvania — and its politics — are moving in two different directions.
New census data show that metropolitan areas like Philadelphia, the Lehigh Valley, Pittsburgh, and Harrisburg are growing — sometimes substantially — thanks to sharp upticks in Latino, Asian, and multiracial residents. Largely white rural areas, meanwhile, are shrinking in population and influence.
Pennsylvania grew by about 300,000 people over the last decade, but most of it was concentrated in cities and suburbs.
“The divide is pretty stark, and it really is divided regionally,” said J.J. Balaban, a Democratic strategist from Philadelphia.
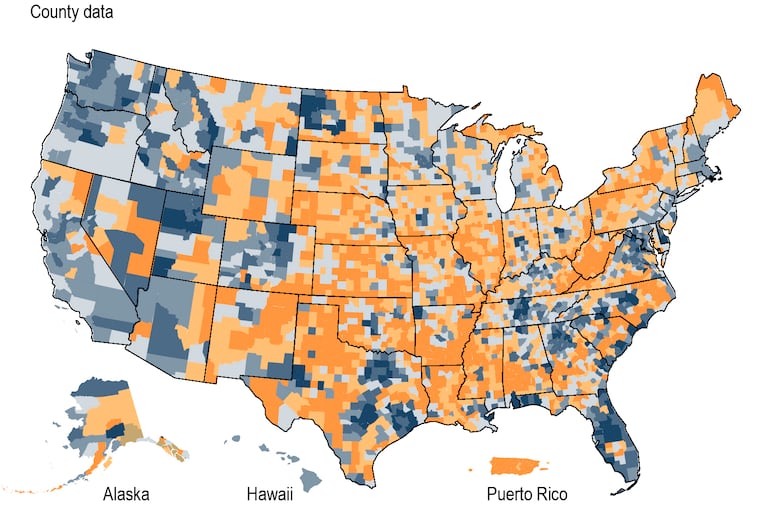
The shifts mirror national trends showing growth in denser, diverse, and generally more liberal areas while conservative rural regions shrink — but retain power thanks to a political system that often gives them disproportionate representation. The decade of changes in the data help explain some of the demographic, economic, and cultural divides that now define much of American politics.
“One of the reasons why we’re kind of stuck in this political moment is that the population and economy are growing and concentrated in these metropolitan areas, but the politics disproportionately favors these more rural areas,” said Michael Jones-Correa, a University of Pennsylvania professor who has studied Latino politics.
Pennsylvania is still nearly three-quarters white, above the national average, which helps Republicans, who heavily rely on white voters.
Still, if the last decade’s trends continue, they foreshadow where the state’s politics may be headed, with even more influence accruing to the Philadelphia region, greater political power among people of color, especially Latino communities, and new battlegrounds taking shape.
Those factors could influence national politics as soon as next year, when Pennsylvania hosts Senate and House races that could help decide control of both chambers. And last week’s census data were released for one key purpose: to be used to redraw Pennsylvania’s congressional and state legislative districts, helping shape power for the next decade.
Here are some details the data revealed and what they may mean:
Southeastern Pennsylvania continues to grow, raising questions for Republicans
Philadelphia and suburban Bucks, Chester, Delaware, and Montgomery Counties added more than 209,000 people in the last decade.
That’s a 5.22% increase, while the rest of the state grew just 1.05%.
And the area has marched to the left, helping swing the state to elect President Joe Biden.
About half of the vote in a Democratic primary now comes from the Philadelphia region, Balaban said, giving it massive influence in races such as the one already unfolding for the 2022 U.S. Senate nomination.
» READ MORE: The Philadelphia suburbs were the key to Joe Biden’s Pennsylvania victory. Here are the numbers.
By contrast, Cambria and Fayette Counties, both GOP bastions in Southwest Pennsylvania, ranked third and eighth nationwide in terms of large counties losing population the fastest, according to Cook Political report analyst Dave Wasserman.
Of Pennsylvania’s 67 counties, the five that gave at least 55% of their vote to Biden grew by 215,100 people over the last decade. The 52 counties that voted at least 55% for Trump declined by 30,500.
Still, members of both parties said the shifts aren’t enough to decisively tilt the state. The decade of changes were already baked into the 2020 election, which had a tight presidential race and GOP victories in key down-ballot contests.
“Parties adapt to reality,” said Mark Harris, a Republican strategist from Pittsburgh. “Philadelphia has grown, but Republican performance in the city of Philadelphia has gotten better and it’s one of the reasons why [Republicans] have been able to continue to win statewide. Demographics are not destiny.”
But Republicans acknowledged that if the population trends continue, it could get harder to win statewide. They differed, though, on how to react.
Pennsylvania’s white population fell by more than 500,000. The numbers increased for Hispanic (by 330,000), Asian (161,000), Black (42,000) and multiracial residents (273,000).
Some Republicans point to former President Donald Trump’s relative improvement with Black and Latino voters in 2020, arguing it shows a path forward if the GOP can become the party of not just working-class whites — Trump’s base — but of a “multicultural working-class” base, as one strategist put it.
» READ MORE: Philly was supposed to turn out huge for Biden. It didn’t. What happened?
Harris agreed that could be the party’s future — but said the GOP still has to compete in the affluent suburbs.
“There’s a difference between losing Delaware County by 10 points and 25 points,” he said. ”One of those allows you to still win statewide and one of those doesn’t.”
At the same time, some Democrats worry they’ll continue losing ground in rural areas, which could undercut their gains in growing Democratic areas.
The new battleground?
Some of the state’s most significant growth came in areas around Harrisburg, such as Dauphin, York, Cumberland, and Lancaster Counties. They’re mostly GOP strongholds, but Democrats are gaining votes.
“It’s moving to be the battleground of the state,” said Ben Forstate, a Democratic analyst from Pittsburgh. “A lot of the people who are moving into those suburbs are more diverse, and they’re younger and they look more like the voters who are becoming Democratic in the [Philadelphia] collar counties.”
But it’s still far from a point where Democrats can win countywide (except Dauphin, where they have had success).
Still, Balaban said, even if Democrats aren’t winning across the counties, that area can play an increasing role in the party’s 2022 primaries for governor and Senate, and could provide a tranche of Democratic votes in general elections.
Changes within the counties could lead to more Democrats in the statehouse, Forstate noted.
Latino growth
The Hispanic population in Pennsylvania grew by 45.8%, fueling some of the state’s strongest growth. As Philadelphia’s white and Black populations dropped, the Latino increase accounted for two-thirds of the city’s overall population growth.
Pennsylvania now has 1.05 million Hispanic and Latino residents, up from 720,000 a decade ago.
In Luzerne County, the population grew by less than 5,000, but the Latino count jumped by 25,000, offsetting a steep drop in white residents. In Lehigh County, the Latino population grew by more than 31,000.
And the growth isn’t concentrated in one area. Some have been drawn to the Lehigh Valley from more expensive places like New York and New Jersey, Jones-Correa said, while others migrated toward agricultural jobs in places like Lancaster County. Cities, he said, have attracted both college-educated migrants and laborers who do construction, work in restaurants, and clean houses.
Latinos now make up 8.1% of the state’s population, while non-Hispanic Black residents account for 10.5%.
David Dix, a strategist who has worked with candidates from both parties, said politicians need to calibrate their approach to a vast demographic that includes people from a wide variety of national backgrounds and political views.
“I haven’t seen the Democratic Party with a clear strategy to engage this demographic that the census has told us is expanding and is going to be impactful in the 2022 elections,” Dix said.
Democrats in 2020 were stung nationally and in Pennsylvania when Trump gained ground with Latinos. Nationwide, he won 41% of Latino voters who did not have college degrees, according to a Pew Research Center study of voters, and Republicans hope to build on that success.
Democrats, however, note that they still won 59% of the Latino vote overall, and argue that one election doesn’t make for a trend. Jones-Correa, of Penn, said one theory for the shift was that the election came when unusual amounts of government aid were flowing, because of coronavirus aid.
“Are Republicans willing to continue that?” he asked. “Are they willing to say, ‘We’re going to support you economically and direct government resources, government programs, to this population?’ ”
Latinos’ influence will grow as the population ages and could change the face of politics in areas where they’re concentrated.
Allentown will likely have a Latino mayor before long, Balaban predicted. Dix pointed to the likelihood of more Latinos winning seats in the state legislature.
Both parties “have to identify stakeholders in those communities and elevate their voices,” Dix said. “It’s not enough to convene and say ‘We’re going to have a Latino discussion today.’ ”
Redistricting implications
Pennsylvania will lose a seat in the U.S. House because it didn’t grow as fast as the rest of the country, and the latest data provide some guide points for the state’s high-stakes redistricting. The new lines, drawn after every census, could help shape Pennsylvania’s House districts and, in turn, which party has the upper hand in the 2022 midterms.
Each of the new districts will need to grow to around 765,000 people, from 722,000. The changes could put some incumbents in danger.
For example, the Scranton-area district held by Democratic Rep. Matt Cartwright needs to grow by about 52,000 people. The district already leans right, and most of the surrounding area it could expand into is even more conservative.
» READ MORE: What to watch as Pennsylvania loses a congressional seat: ‘The stakes are really high’
Democratic Reps. Susan Wild, of Lehigh County, and Chrissy Houlahan, of Chester County, may be on more solid footing. Their districts are closer to the required population count. So barring massive political surgery, the districts might not have to change much — making it harder for Republicans to add more conservative territory.
Meanwhile, Republican districts could see substantial change, particularly in the deep-red central, southwestern, and northwestern parts of the state, where the population has dropped dramatically. Five of the current Republican-held districts stand at least 70,000 voters short of the new size requirement. Democrats argue that areas losing people should also lose the House seat — a move that could force two GOP districts to combine, effectively eliminating one Republican seat.
The congressional lines will be negotiated by the Republican-controlled state legislature and Democratic Gov. Tom Wolf.
State House and Senate districts will be redrawn by a five-member commission including the Democratic and Republican leaders of both chambers and a tiebreaker, University of Pittsburgh leader Mark A. Nordenberg, who was appointed by the state Supreme Court.
Because these districts are smaller than the congressional ones, they may feel population shifts more acutely.
Population trends generally favor Democrats.
Of the 88 districts they hold, 49 are larger than average, meaning most have experienced growth and can potentially be split into new, Democratic districts. For example, Philadelphia and its suburbs have grown enough to warrant another two districts.
Republicans’ 113 districts include 61 that are smaller than average, meaning most of their districts need to grow, potentially cannibalizing other conservative districts.
Once state workers process the census redistricting data and deliver it to the commission, the state constitution gives them 90 days to draw a legislative map.
And then comes the 2022 elections — the first test of the new maps, and another look at how the parties will navigate the state’s changing political geography.